Create Structure
Create Structure #
This section describes how to create certain complex structures in the software.
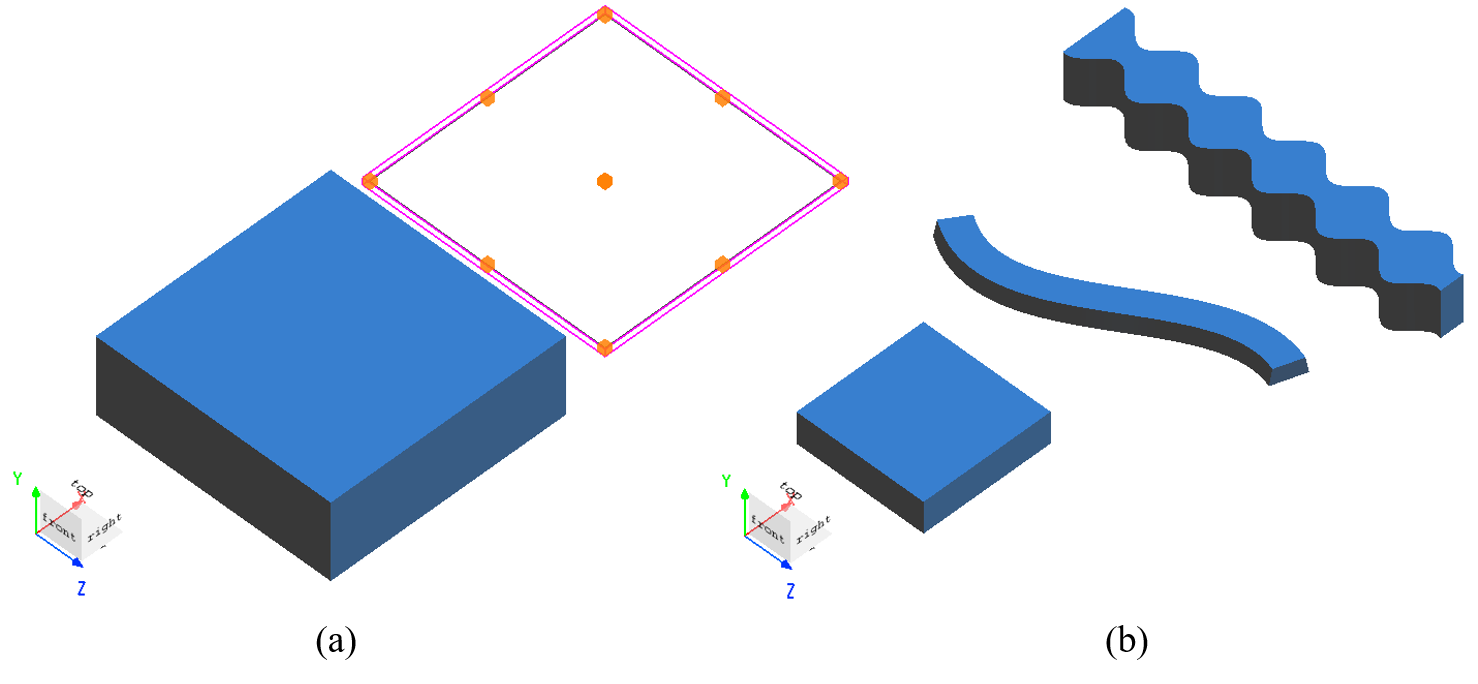
The software provides a wide range of structure types to meet the users' various needs of modeling complex structures. In terms of dimension, structures can be classified into 2D structures and 3D structures, as shown in Figure (a). In terms of structural shape, they can be classified into simple geometric structures, curve (Bézier curve) structures, extrusion (or revolution) structures created by functions, etc., as shown in Figure (b).
Create 2D Structure #
2D structures are a special type of structure characterized by no thickness in the direction of the normal vector. These structures represent idealized approximations of ultra-thin materials in the software, and can be used for different simulations.
The software supports the functionality of adding 2D polygonal structures through scripts, allowing users to create complex structures through scripts according to their actual needs. The following two examples demonstrate how to create complex 2D structures.
Example: 2D Circle Ring #
The following code demonstrates how to add a 2D circle ring structure using a script:
Rin = 0.5e-6;
Rout = 1e-6;
res = 100;
xin = Rin.*cos(linspace(0,2*pi,res));
yin = Rin.*sin(linspace(0,2*pi,res));
xout = Rout.*cos(linspace(0,2*pi,res));
yout = Rout.*sin(linspace(2*pi,0,res));
V = [xin,xout;
     yin,yout];
add2dpolygon;
set("name","2d ring");
set("vertices",V);
After running the script, the structure created is shown in the figure below (the image has been processed):

Example: Cross-Shaped Hole #
The following code demonstrates how to add a 2D cross-shaped hole structure using a script:
x_span = 2e-6;
y_span = 2e-6;
W = 1e-6;
L = 0.4e-6;

x = [W/2;L/2;L/2;-L/2;-L/2;-W/2;-W/2;-L/2;-L/2;L/2;L/2;W/2];
y = [L/2;L/2;W/2;W/2;L/2;L/2;-L/2;-L/2;-W/2;-W/2;-L/2;-L/2];

V = [x,y;
     W/2,0;
     x_span/2,0;
     x_span/2,-y_span/2;
    -x_span/2,-y_span/2;
    -x_span/2, y_span/2;
     x_span/2, y_span/2;
     x_span/2,0;
     W/2,0];
add2dpolygon;
set("name","2d cross hole");
set("vertices",V);
After running the script, the structure created is shown in the figure below (the image has been processed):

Curved Structure #
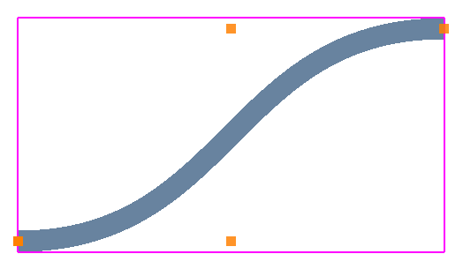
Example: S-Bend Waveguide #
Edit Structure #
After creating a Sidewall bezier structure, if you need to edit its structural parameters, you can either right-click the structure in the object tree or double-click it in the Composite viewer to open the Edit Structure Properties window.
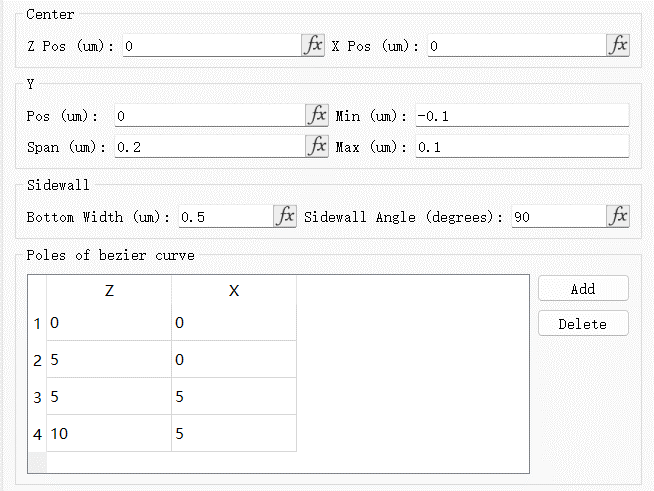
In the parameter window of the Sidewall bezier structure, the Sidewall tab includes the following functionalities:
| Name | Description |
|---|---|
| Bottom width | The width of the structure bottom. |
| Sidewall angle(degrees) | The inclination of the structure sidewall. |
The Poles of bezier curve tab can be used to set up the poles of the Sidewall bezier structure.
For more settings in the Geometry tab, see Structure. The parameters setup for this example are shown in the figure below:
Structure Inspection #
The S-bend waveguide structure is shown in the figure below:
Equation-Controlled Structure #
Edit Structure #
After creating an Equation structure, you can set up its geometric dimensions. See Structure for settings.
Structure Setting #
Click the Geometry > Equation tab. You can set up the equations used to create structures.
| Name | Description |
|---|---|
| Equation 1 | Define the equation for the upper region. |
| Make nonsymmetric | To be enabled only for creating an extrusion structure. |
| Equation 2 | Define the equation for the lower region. This option is only available when the Make nonsymmetric is enabled. |
| Create 3D geometry by | Select the Revolution or Extrusion. |
| Equation length units | The units used in the equation. |
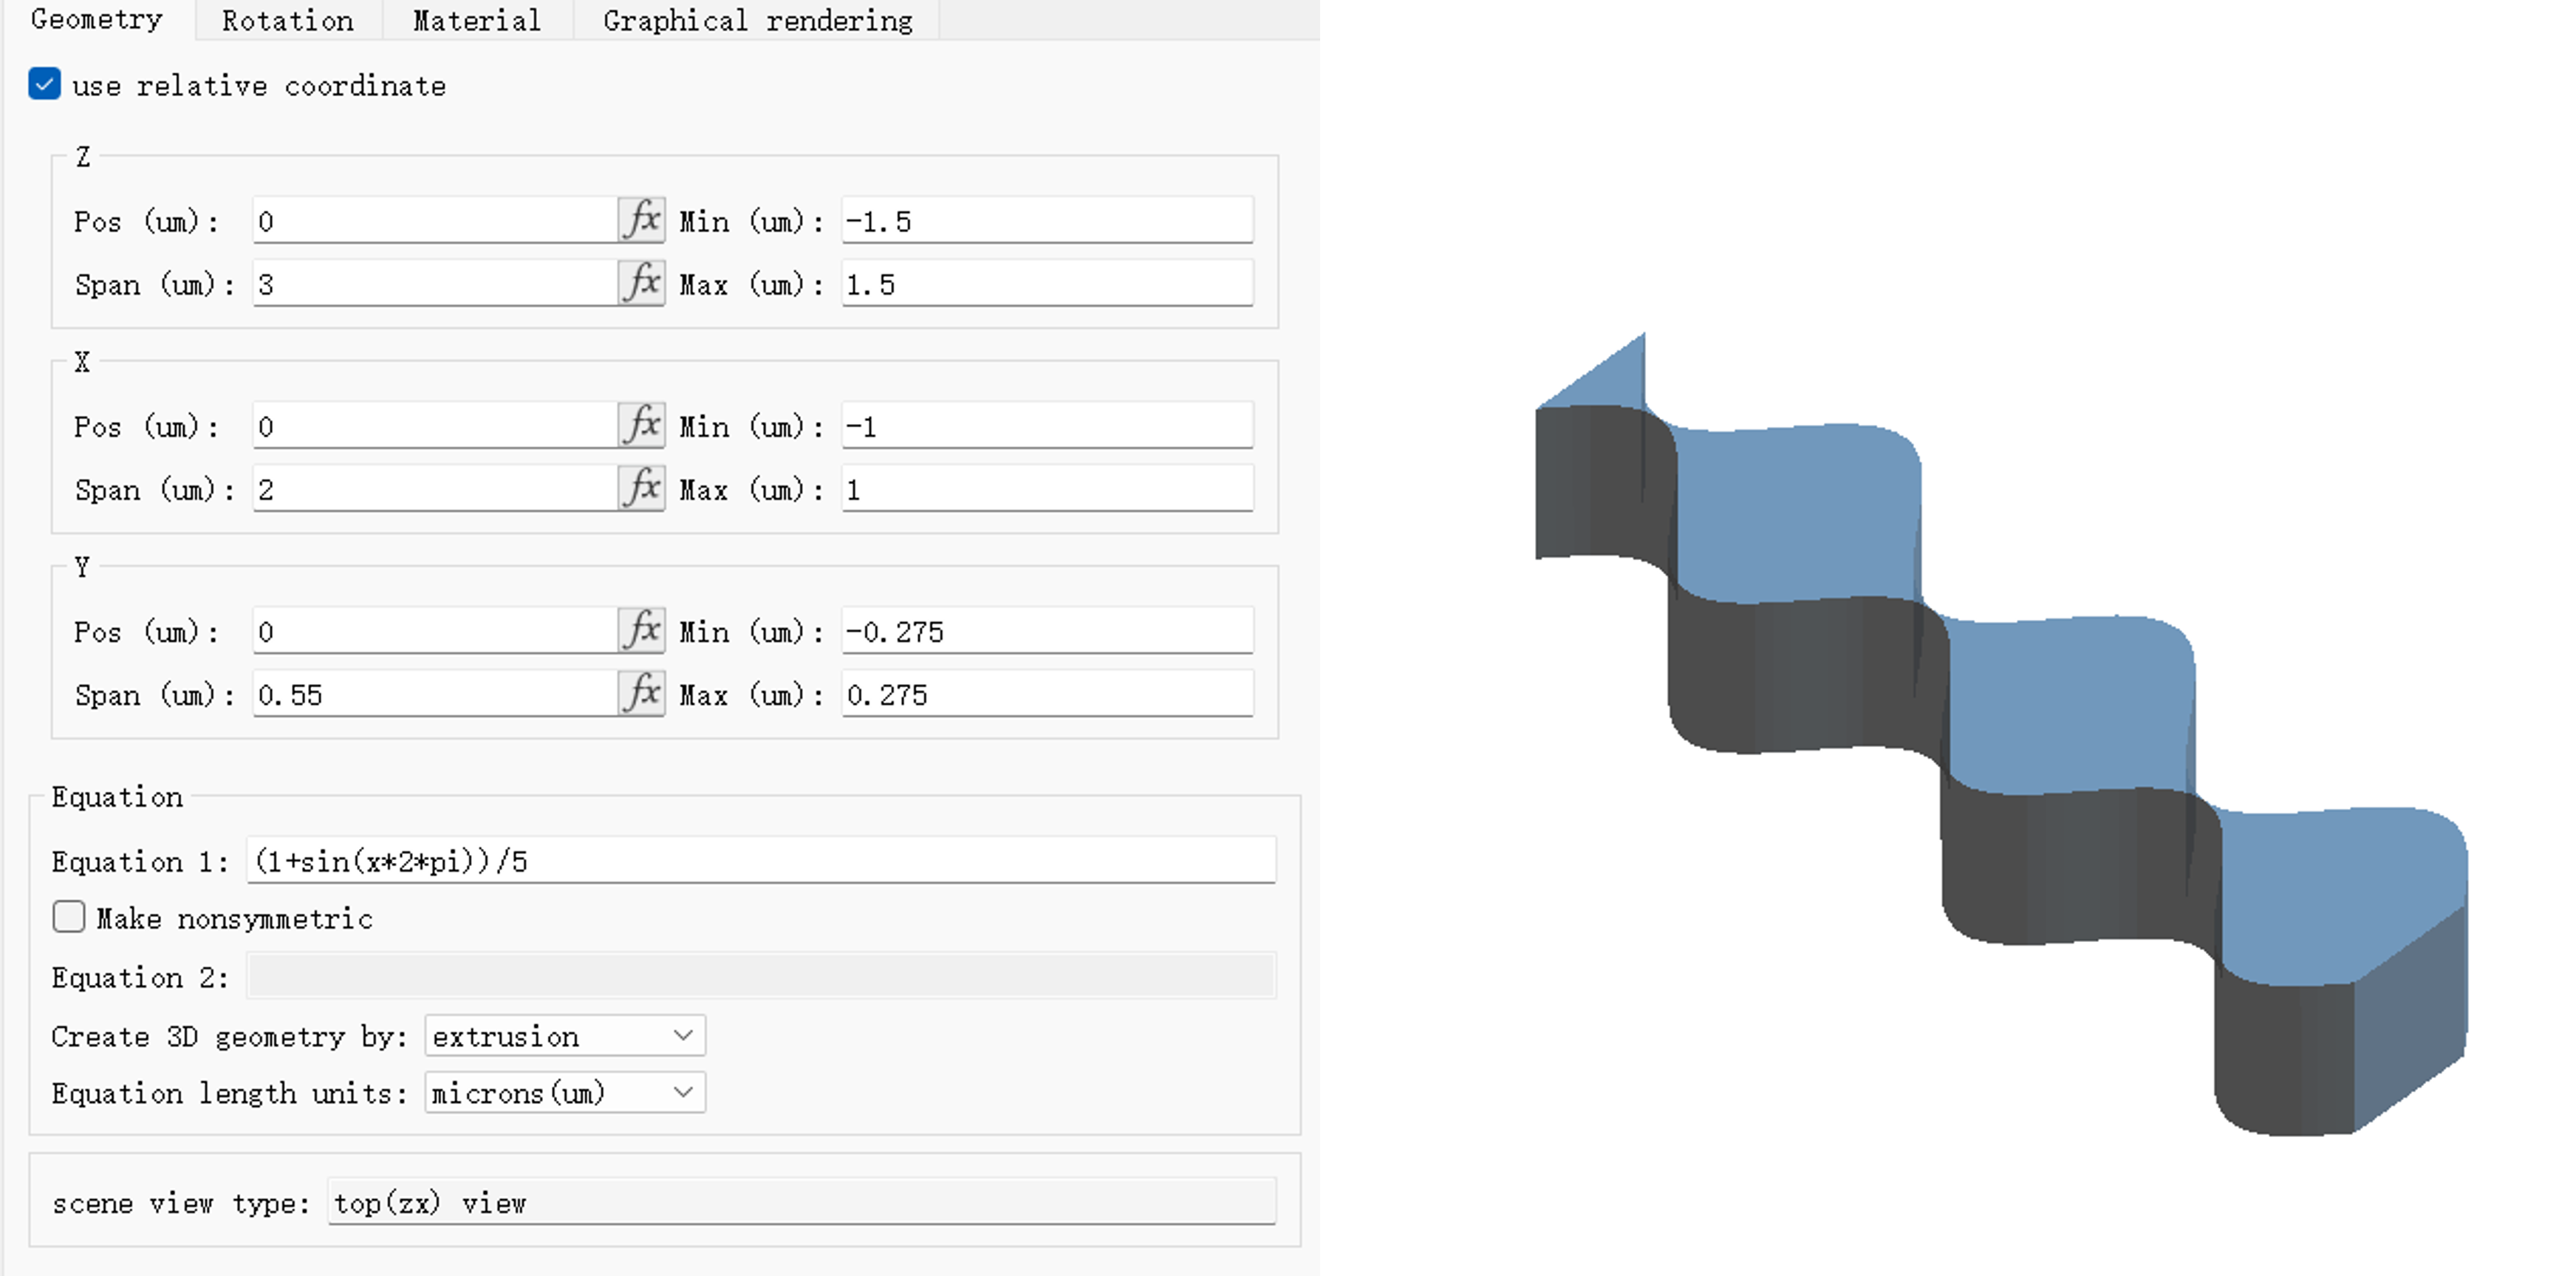
Example: Create Extrusion Structure #
After adding an Equation structure, the geometry and equation settings of the structure are shown in the following figure. After all the parameters are set up, you can visualize the structure in the Composite viewer.
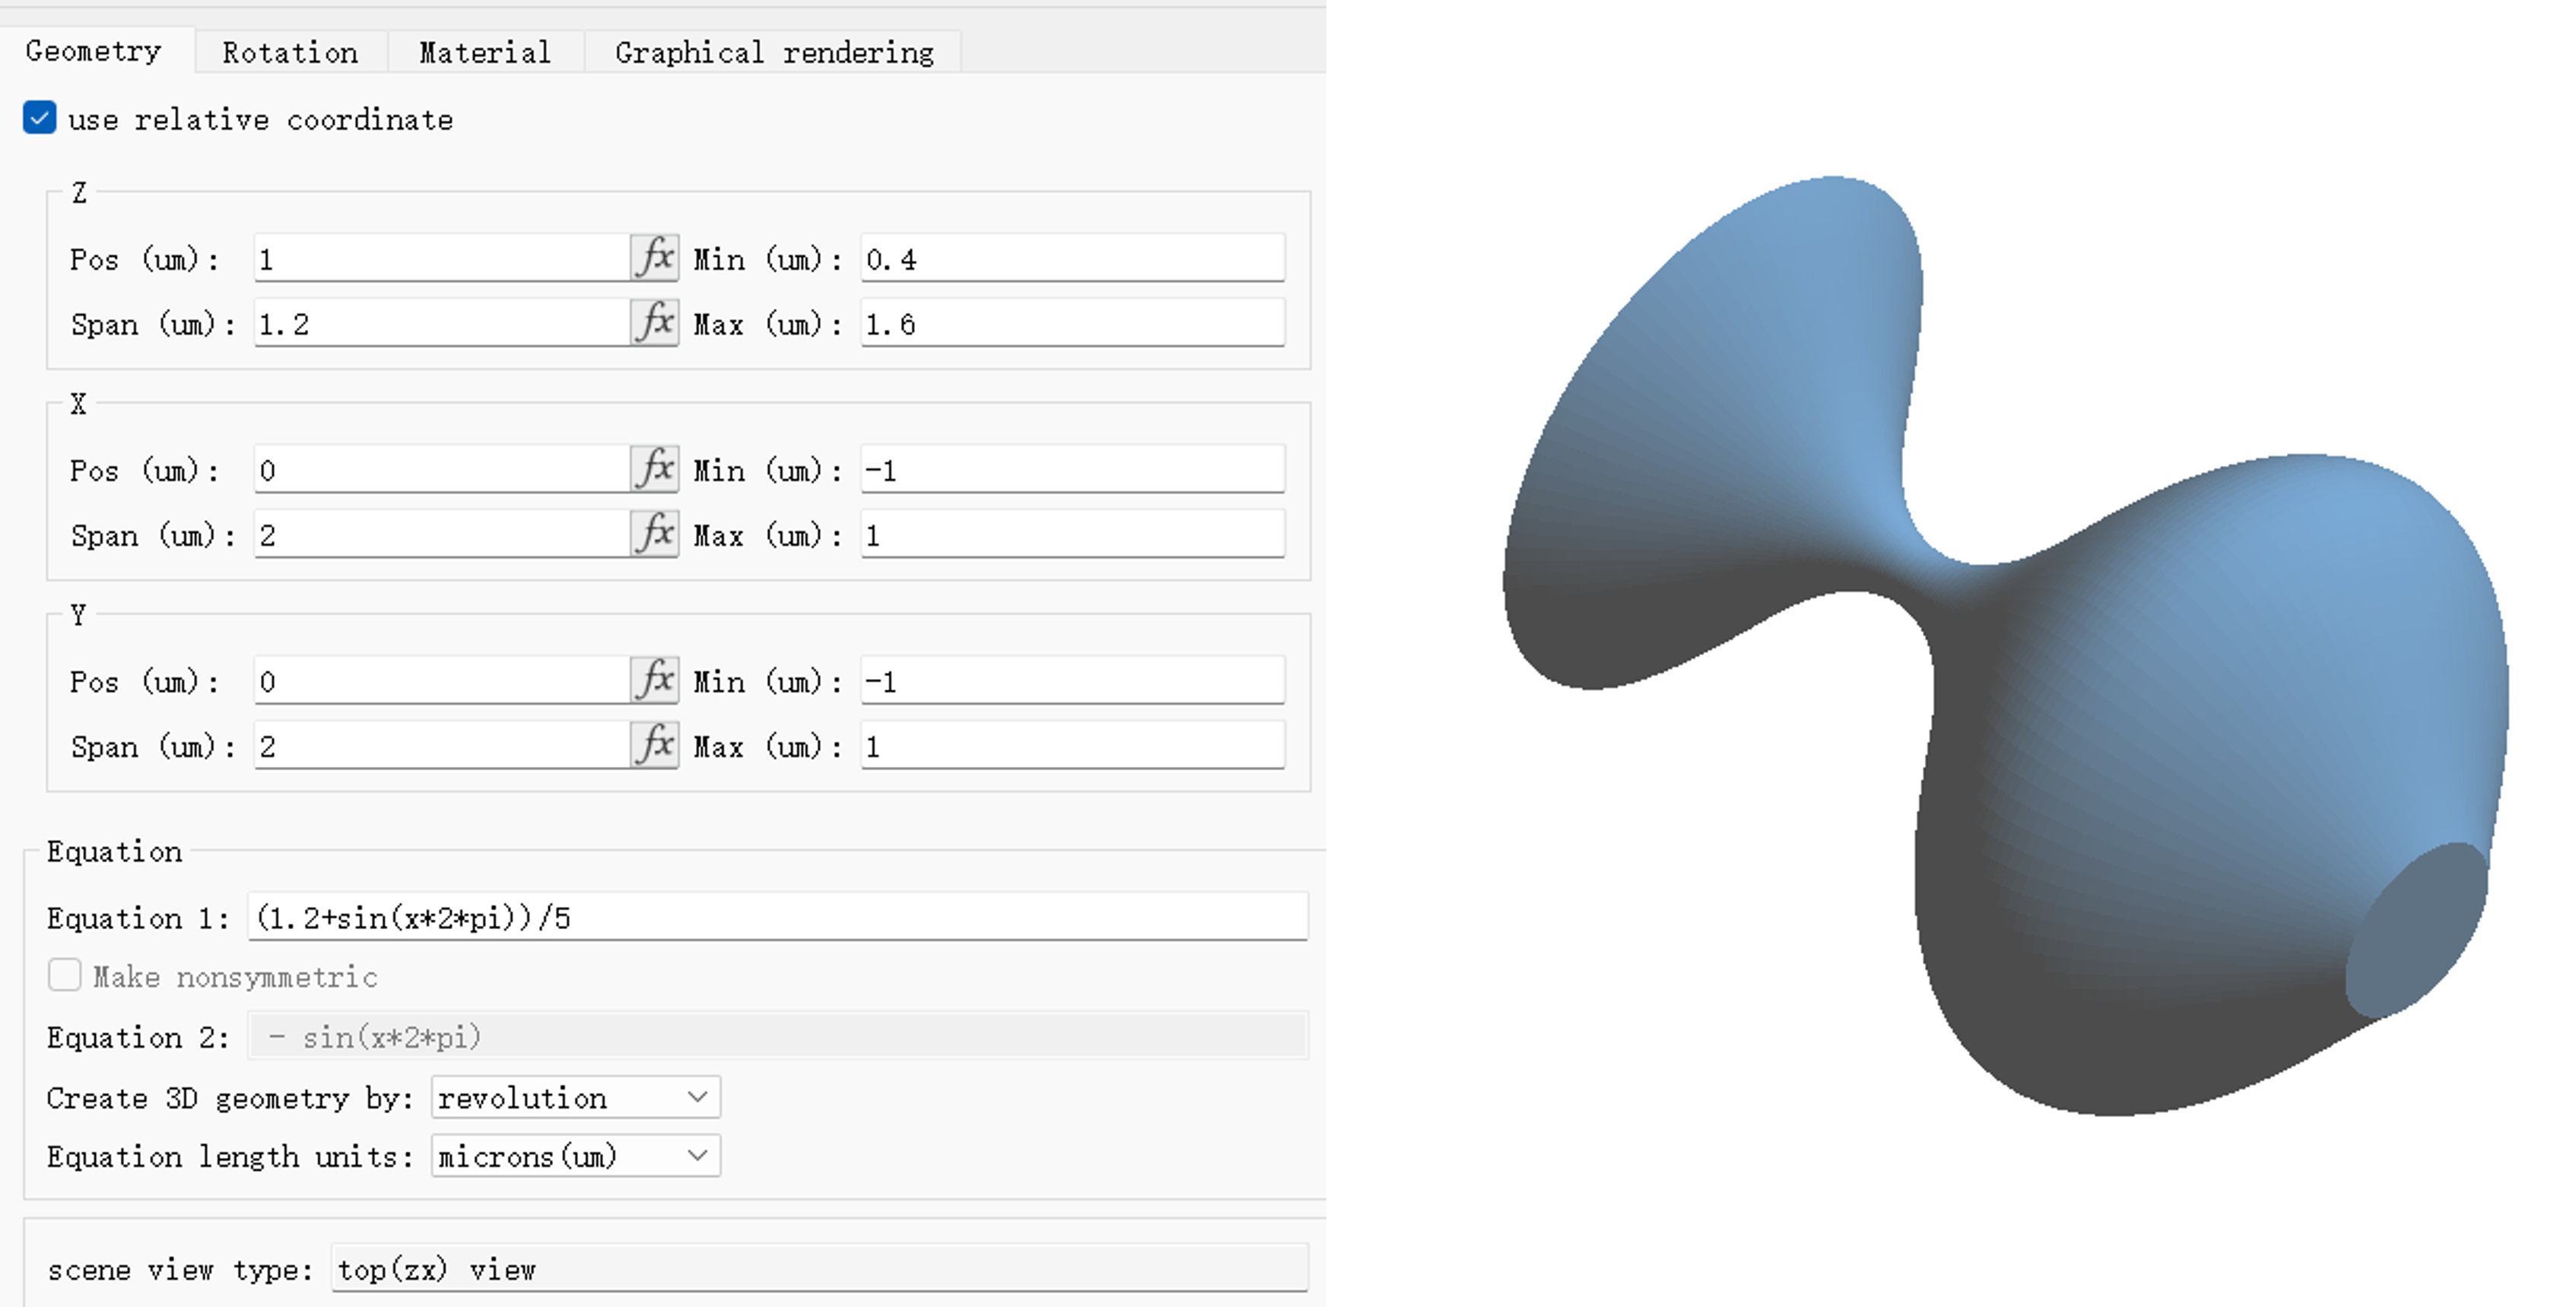
Example: Create Revolution Structure #
After adding an Equation structure, the geometry and equation settings of the structure are shown in the following figure. After all the parameters are set up, you can visualize the structure in the Composite viewer.
Surface Import #
This software supports importing surface height matrix data from a .txt file to generate freeform surfaces. This feature is suitable for modeling complex irregular surfaces, such as those obtained from atomic force microscopy(AFM).
File Format #
The file should follow one of the formats shown below. Values can be separated by spaces, commas, or tabs. Column alignment is not required. The value Z(x,y) represents the surface height, and m, n denote the data range along the x, y axis, respectively.
| Description | File format |
|---|---|
| Includes x and y data |  |
| Excludes x and y data |  |
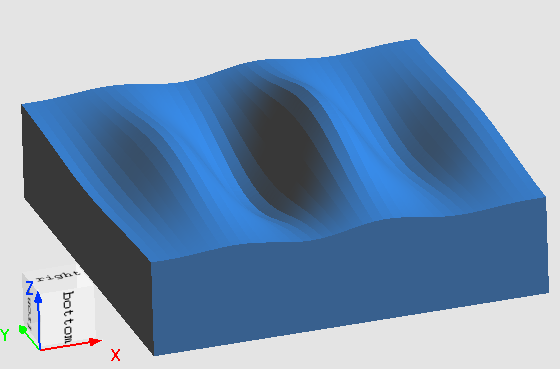
Example: Importing a Freeform Surface #
Prepare a .TXT file according to the specified format:
nx = 50;
ny = 40;
x = linspace(-6,6,nx);
y = linspace(-5,5,ny);
[X,Y] = ndgrid(x,y);
Z = exp(-(X.^2+Y.^2)/4.^2) .* sin(pi*Y/2);
filename = "usr_surface.txt";

# write the data to file
writem(filename, Z);
fclose(filename);
Click Import in the Home tab and select Surface to open the surface import window.
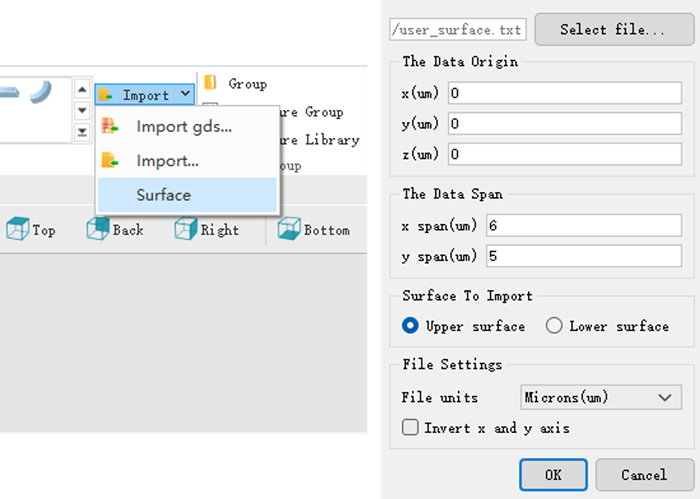
- Select file: Choose the data file to be imported.
- The Data Origin:Set the origin of the surface in global coordinates.
- The Data Span:Define the physical span of the surface. This is disabled if the file includes x and y data.
- Upper surface: The surface grows from the top of the structure. In the data, Z(x,y)>0 indicates an outward extension of the structure, while Z(x,y)<0 represents an inward cut.
- Lower surface: The surface grows from the bottom of the structure. In the data, Z(x,y)>0 indicates an inward cut into the structure, while Z(x,y)<0 represents an outward extension.
- File units:Choose the unit of the imported data.
- Invert x and y axis:Check this box to swap the x and y axis.