Setting EME Simulation Control Panel
EME Control Panel #
This section introduces the simulation control panel for the Eigenmode Expansion (EME) solver.
The functions of its control panel buttons are shown in the figure below:

| Name | Description | |
|---|---|---|
| Design | To Design | Switch back to the design view. |
| Graphics | Translucent | Set the transparency of objects; 1 for opaque, 0 for completely transparent. |
| Hide Material | Hide the material structure in the view; check to enable. | |
| Hide Fields | Hide the field distribution in the view; check to enable. | |
| Progress | Status | Display the current simulation status and progress. |
| Run EME | Run the EME simulation to obtain monitor data and eigenmode results for each cell and port. | |
| Tool | Control the opening and clearing of simulation data files. | |
| EME Analysis | Hide EME Analysis Window | Hide the EME analysis window. |
EME Analysis Window #
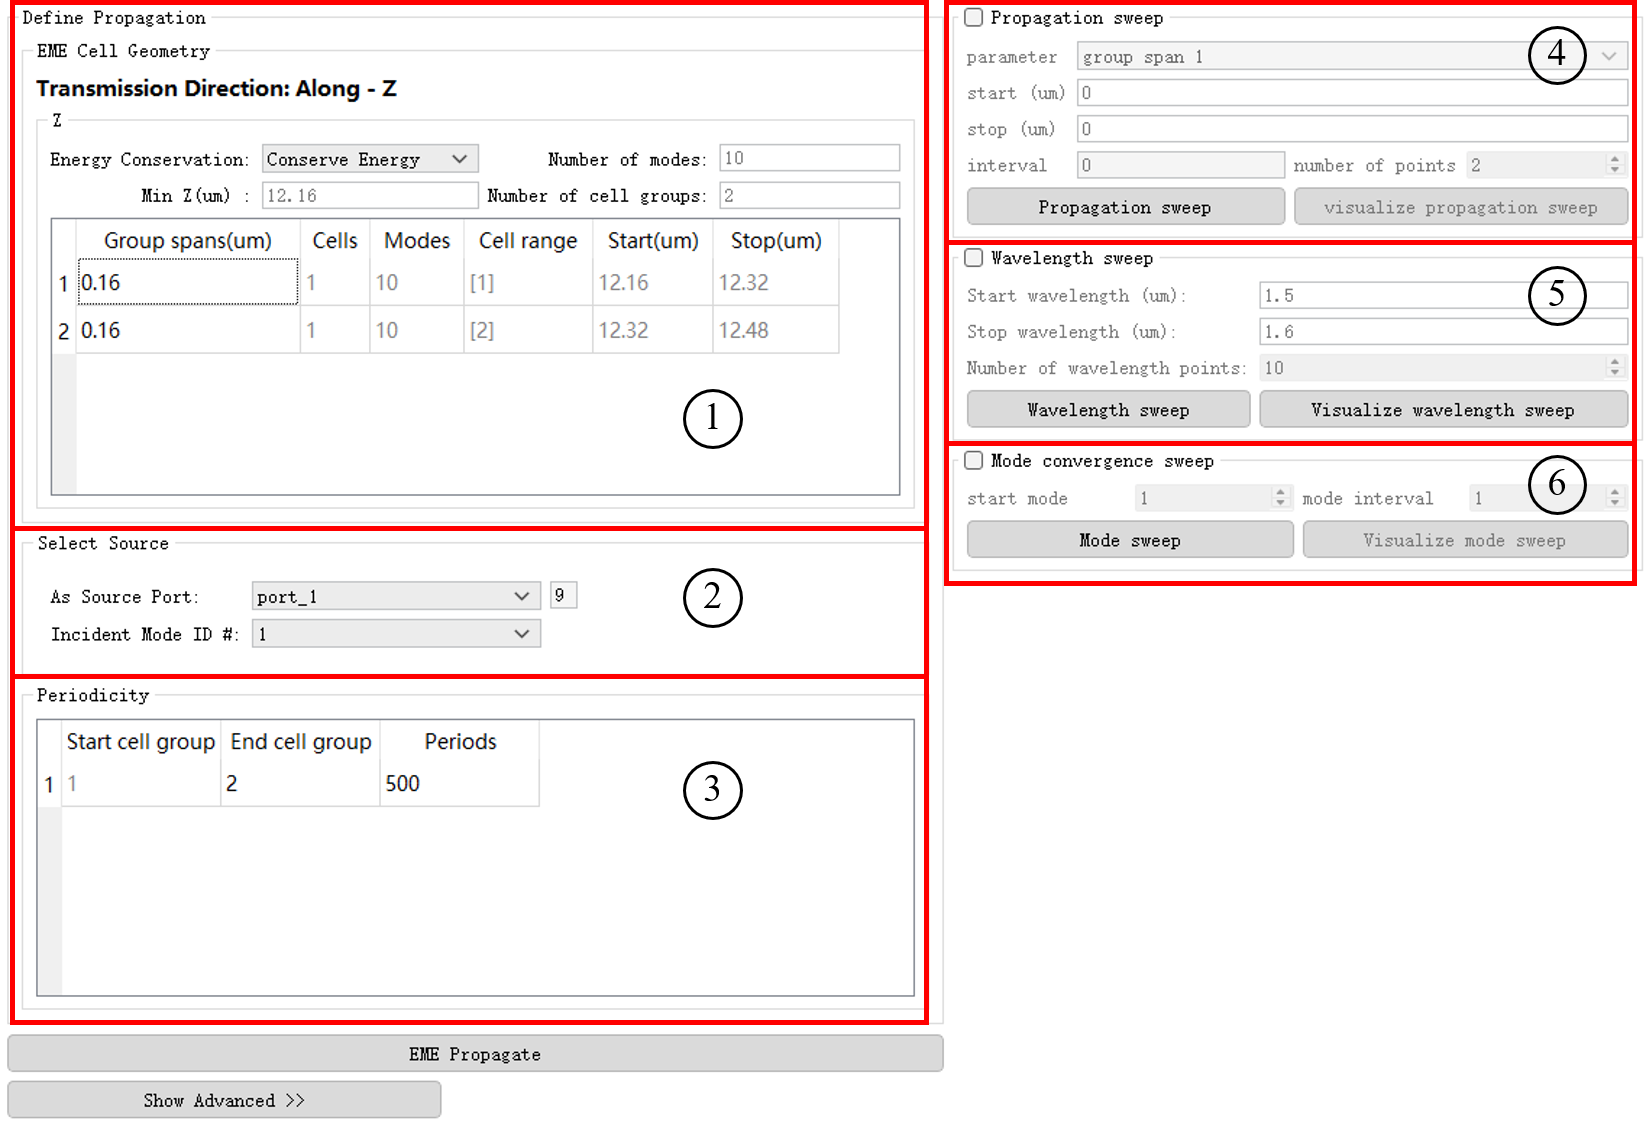
After clicking to run the EME simulation, the EME analysis window will appear. The specific functions are as follows:
| Number | Name | Description |
|---|---|---|
| 1 | EME Cell Geometry | Define the position, range, and number of sub-cells of a cell group. |
| 2 | Select Source | Configure the input source port and injection mode. |
| 3 | Periodicity | Modify the repetition number of periodic regions. |
| 4 | Propagation Sweep | Sweep the cell group length to analyze the impact of different region lengths on the S‑matrix. |
| 5 | Wavelength Sweep | Sweep the S‑matrix as a function of wavelength. |
| 6 | Mode Convergence Sweep | Test the convergence of the S‑matrix by increasing the number of modes. |
Click the EME Propagate button to calculate the S‑parameter matrix for each port according to the user settings.
Tolerances can be set in the advanced settings. For details, please refer to the Advanced section of the EME solver.
EME Cell Geometry #
This section displays the position and range of each cell group in a table format. Its settings are consistent with the EME Settings under the EME solver properties.
Select Source #
This section is used to configure the input light source. These settings only affect the field distribution recorded by the EME profileMonitor and do not affect the S‑matrix results.
| Name | Description |
|---|---|
| As source port | Select an existing port from the list as the light source injection port. |
| Incident mode ID # | Select the number of the injection mode. |
Periodicity #
For structures with periodicity, you can specify in this section which units are periodic and the repetition number of the periodic units. This feature is often used to sweep the number of periods for devices such as fiber Bragg gratings (FBG).
| Name | Description |
|---|---|
| Start cell group | The starting cell group of the periodic cells. |
| End cell group | The ending cell group of the periodic cells. |
| Periods | The number of times the periodic cells are repeated. |
Propagation Sweep #
Sweep the length (span or period) of a cell group to analyze the impact of different region lengths on the S‑matrix. This feature allows you to quickly calculate S‑matrix results over a range of lengths without having to recalculate the modes for each cell.
| Name | Description |
|---|---|
| Start (um) | Set the starting length of the cell group to be swept. |
| Stop (um) | Set the stopping length of the cell group to be swept. |
| Interval | Set the length interval between sweep points. |
| Number of points | Set the total number of points within the sweep range. |
| Propagation sweep | Click to run the propagation sweep. |
| Visualize propagation sweep | Click to visualize the S‑matrix elements as a function of the cell group length. |
The sweep step can be defined by either the length interval or the number of points (choose one of the two).
Wavelength Sweep #
Specify the wavelength range and the number of calculation points to sweep the S‑matrix as a function of wavelength. The wavelength sweep does not recompute the modes and is suitable for scenarios where the mode profile does not change significantly with wavelength.
| Name | Description |
|---|---|
| Start wavelength (um) | Set the start wavelength. |
| Stop wavelength (um) | Set the stop wavelength. |
| Number of wavelength points | Set the number of points for the wavelength sweep. |
| Wavelength sweep | Run the wavelength sweep. |
| Visualize wavelength sweep | View the wavelength sweep results. |
Mode Convergence Sweep #
Vary the maximum number of modes in each EME cell to obtain the S‑matrix as a function of the mode count, thereby testing convergence with respect to the number of modes. Since modes do not need to be recalculated, differences in the S‑matrix under different mode counts can be compared quickly.
| Name | Description |
|---|---|
| Start mode | Set the starting number of modes. To ensure the integrity of the S‑matrix, this value must be greater than or equal to the maximum number of modes among all ports. |
| Mode interval | Set the step by which the number of modes increases. |
| Mode sweep | Run the mode convergence sweep. The sweep will start from the start mode and increase by the mode interval until the number of modes currently set in the simulation is reached. |
| Visualize mode sweep | View the visualization of S‑matrix elements as a function of the number of modes. |
During the sweep, if different cell groups have different maximum allowed numbers of modes, the sweep will go up to the largest maximum among all cell groups. The number of modes in all cell groups increases simultaneously; when a cell group reaches its own maximum, it stays at that maximum while the other cell groups continue to increase until they reach their respective maxima.
EME Ribbon #
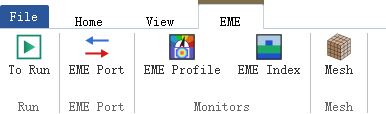
The ribbon of the EME solver provides three main functions: EME Port, Monitor, and Mesh.
- EME Port: Used to add a port group; its settings are essentially the same as regular ports.
- Monitor: Used to add a field profile monitor (EME Profile) and a refractive index monitor (Index).
- Mesh: Used to add a custom mesh within the EME simulation region.
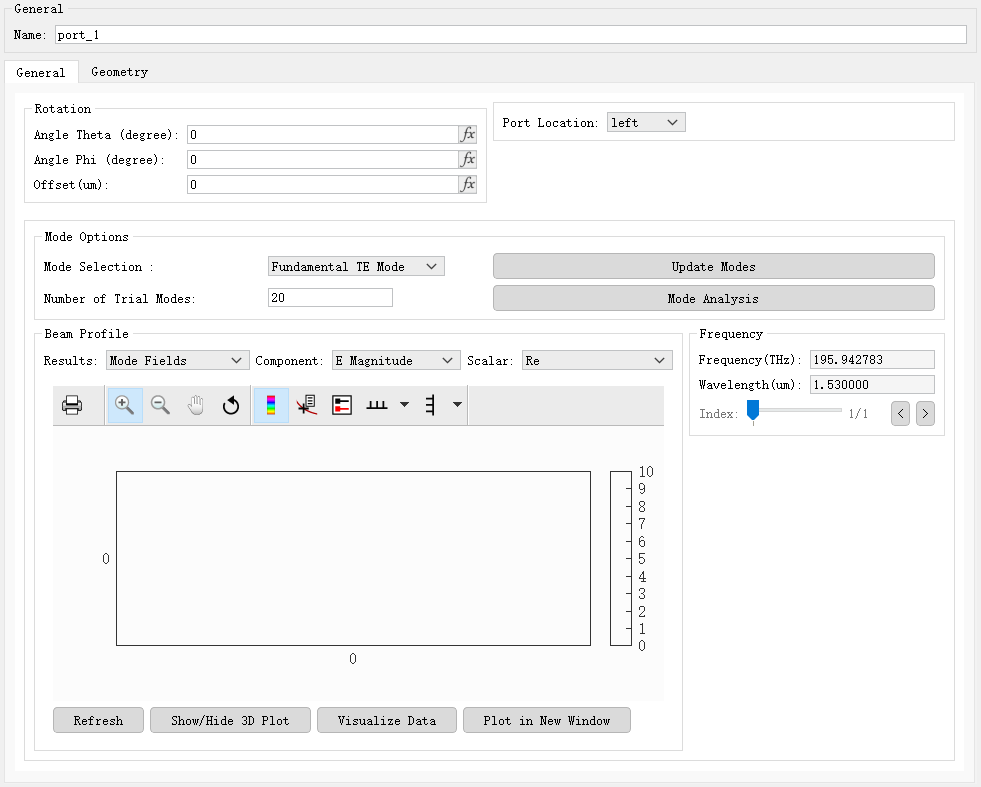
EME Port #
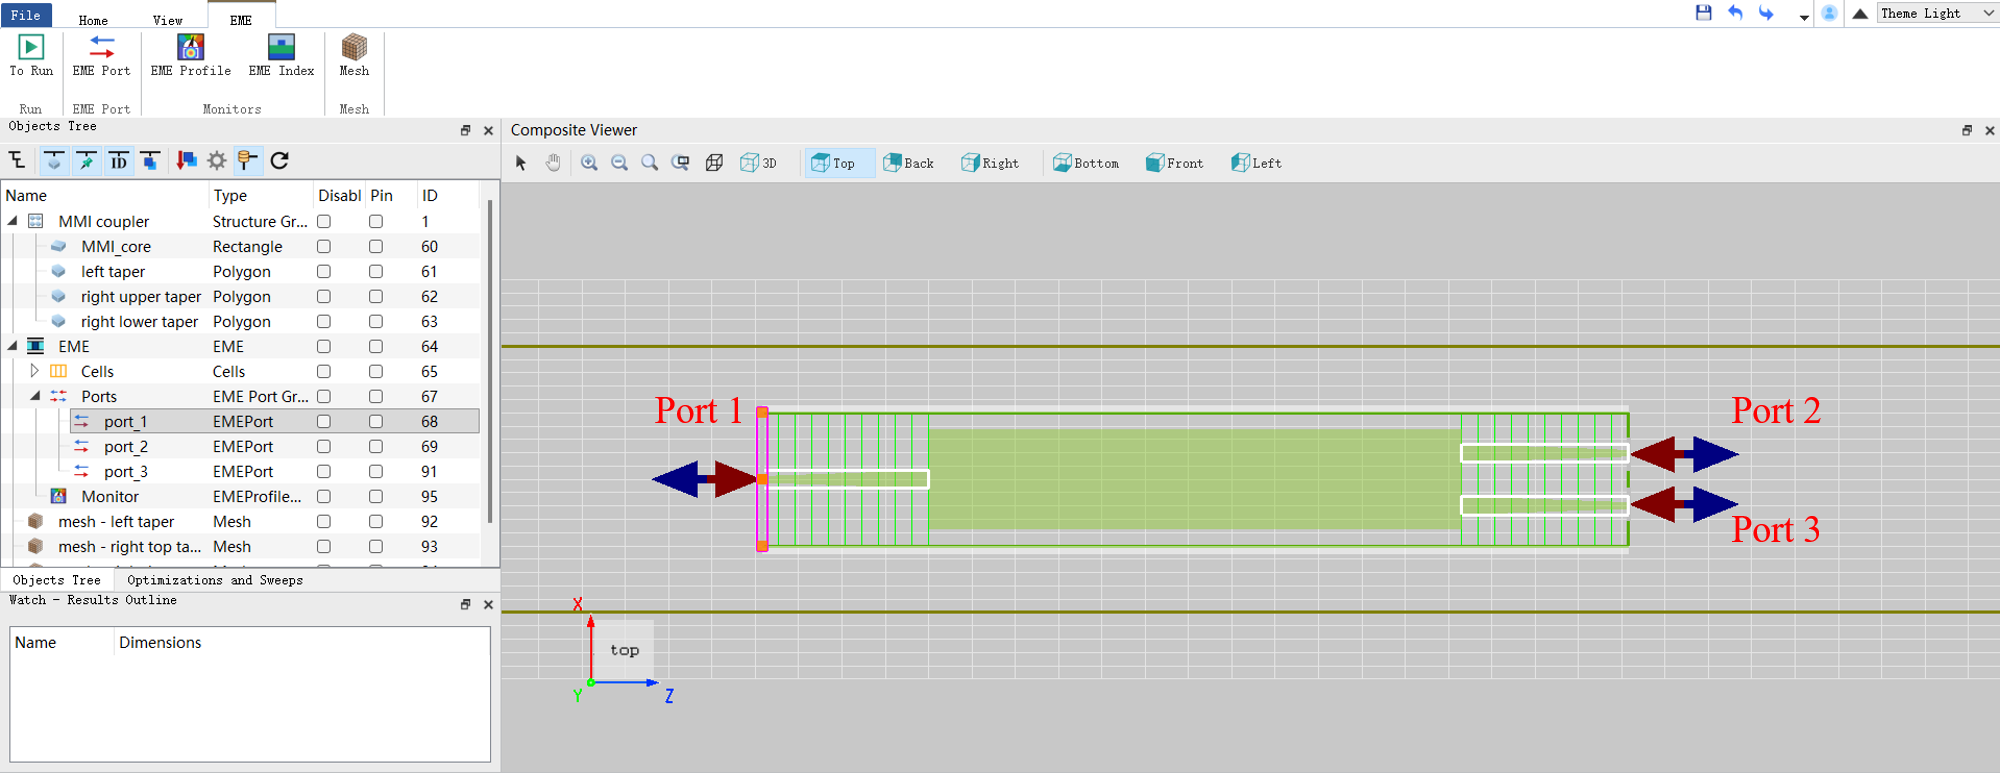
Clicking EME Port adds an Ports, which contains two ports by default. The detailed settings for this port group are described below.
Geometry #
The Ports geometry by default coincides exactly with the EME solver region. The user can manually choose to place the input port on the left or right side of the EME solver region. Additionally, the port width can be adjusted by setting the Geometry parameters for each port within the group.
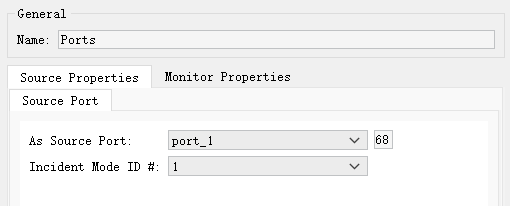
Source Properties #
The Source Properties in the Ports are used to define how the light source is injected.
| Name | Description |
|---|---|
| As source port | Select from the dropdown list which port in the current group will act as the light source injection port. |
| Incident mode ID # | Specify the mode ID number for the injected light. This number corresponds to the eigenmode number (starting from 1) calculated for that port. |
Monitor Properties #
Monitor properties are used to set the recording attributes when the port acts as a monitor.
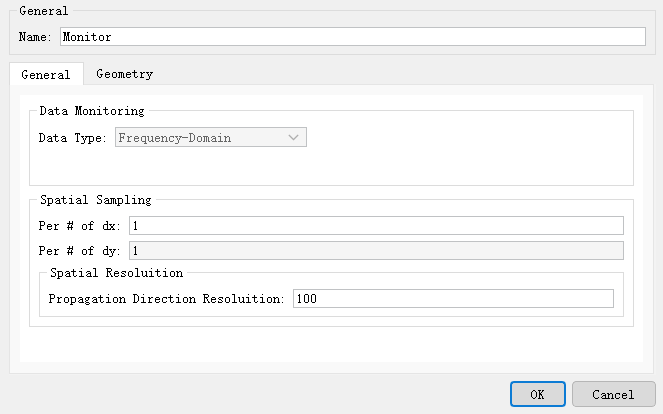
| Name | Description |
|---|---|
| Data type | The type of data recorded; here it is Frequency-domain, a read-only parameter. |
| Spatial sampling | Spatial sampling. Sets the spatial sampling resolution. |
| Spatial resolution | Sets the resolution in the propagation direction. The default value is 100. |
Port Settings #
Right-click on an individual port within the Ports to access and configure its detailed properties. Most of the settings are the same as those for regular ports; for details, please refer to Port Settings.
Monitors #
The EME solver currently includes two monitors: the field profile monitor (EME Profile) for recording the field distribution along the propagation direction, and the refractive index monitor (Index) for recording the refractive index distribution of the waveguide structure. In addition, the transmission and reflection characteristics at the device ports can be obtained from the S-parameter matrices in the "EME Results" section below; these matrices reflect the transmission, reflection, and mode conversion information between different modes at each port.
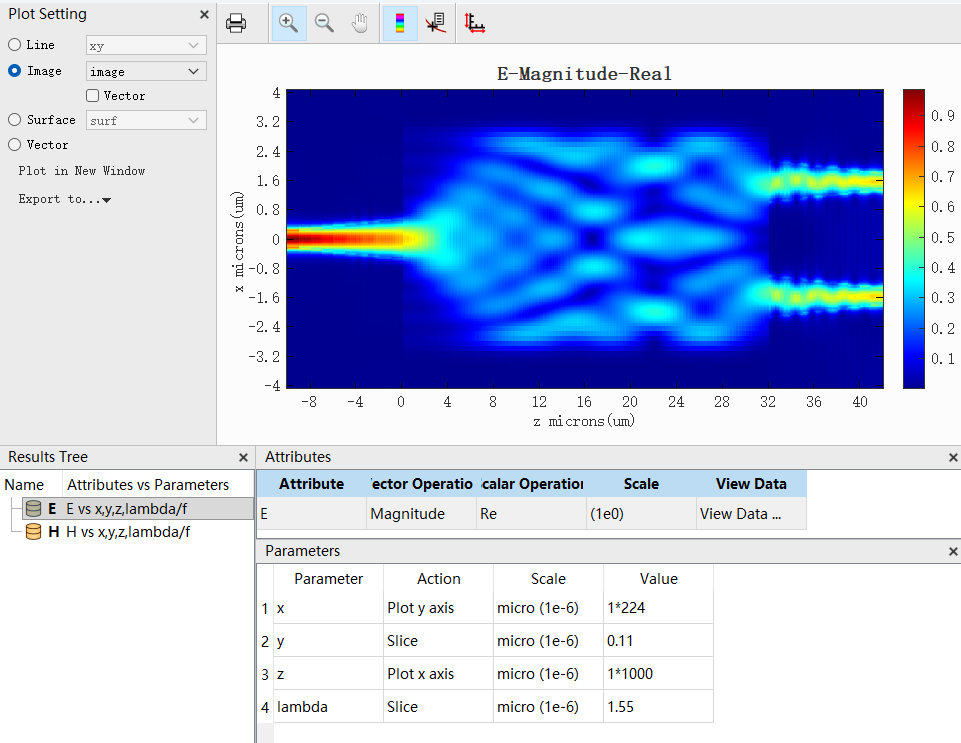
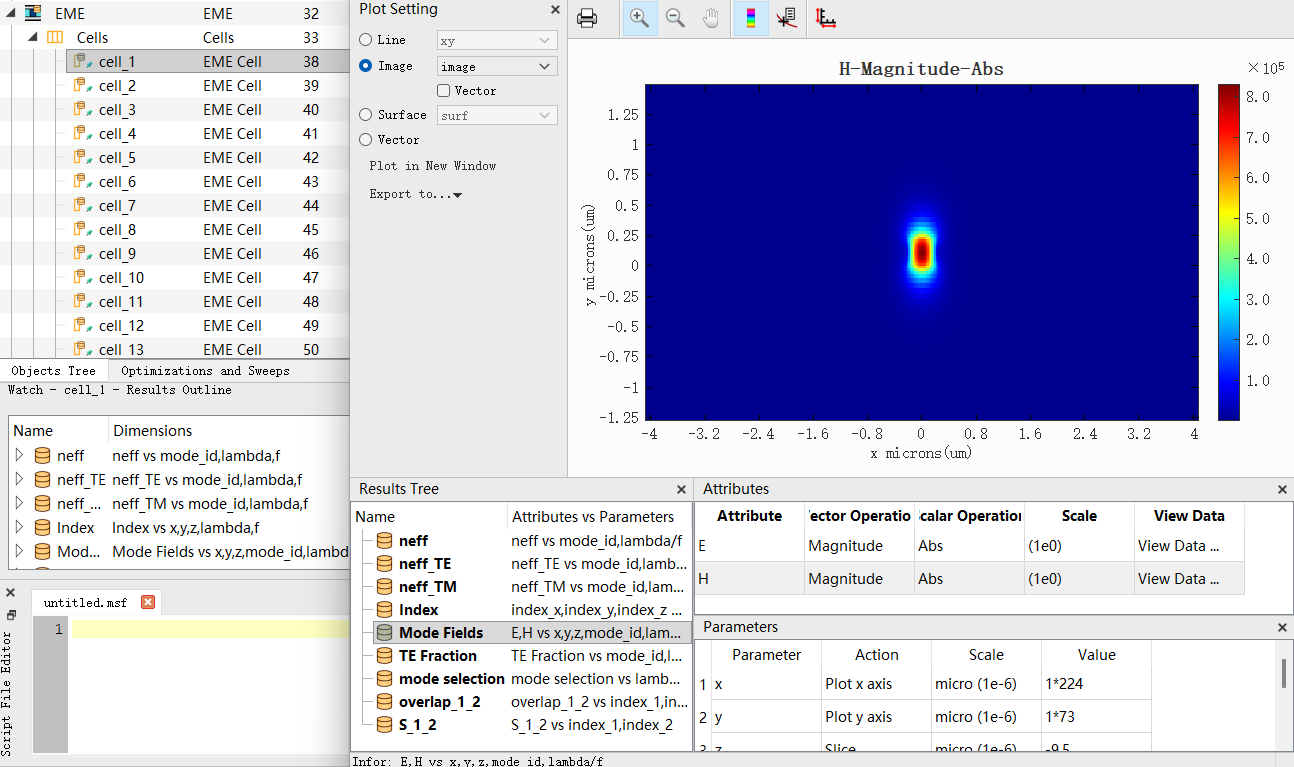
EME Profile #
This monitor is used to view the electromagnetic field distribution along the propagation direction within the simulation region. Its basic settings are the same as those of the FDFP monitor; for details, see FDFP Monitor. For MMI devices, this monitor can intuitively show the propagation of the electromagnetic field within the device, as shown in the figure below:
Index #
This monitor is used to view the relative refractive index distribution within a specified region. Its basic settings are the same as those of the Index monitor in the FDTD solver. For details, please refer to Refractive Index Monitor Settings.
Mesh #
This option allows users to add a custom mesh. Its basic settings are the same as those of the custom mesh in the FDTD solver. For details, please refer to Custom Mesh Settings.
EME Results #
After the EME solver simulation is completed, the results mainly consist of the following three parts:
- S-parameter results: Stored in the EME solver, providing two sets of S matrices: Internal S Matrix and User S Matrix.
- Monitor data: Including the field distribution recorded by the field profile monitor (EME Profile) and the refractive index distribution recorded by the refractive index monitor.
- Cell and port mode information: Eigenmode information obtained from each cell (such as effective index, mode field distribution, etc.), and mode field data recorded at the ports acting as monitors.
The various types of results from the EME solver are described in detail below.
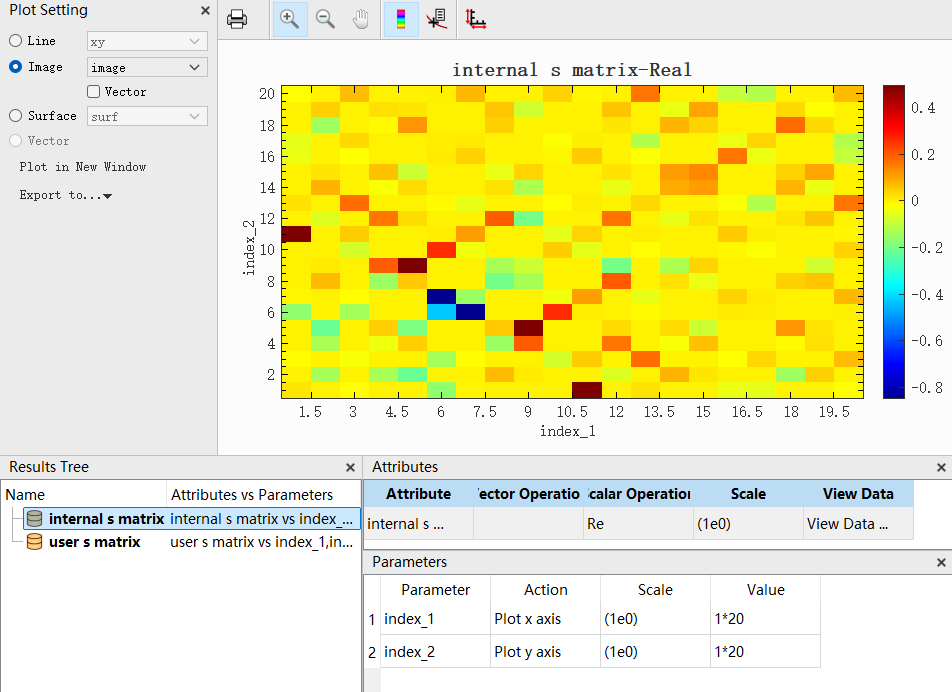
Internal S Matrix #
The Internal S Matrix is the eigenmode scattering matrix calculated based on all cell interfaces in the EME algorithm. During simulation, the EME solver divides the device into multiple cells along the propagation direction and calculates the transmission and reflection coefficients between all possible modes at each cell interface. By cascading the S matrices of these cell interfaces, the Internal S Matrix of the entire device is finally obtained. This matrix contains the complete response between all possible modes at the input and output ports and is a generalized scattering matrix reflecting the intrinsic characteristics of the device.
User S Matrix #
The User S Matrix is the S-parameter result calculated based on the specific modes selected by the user at the ports. Users can specify the modes of interest (e.g., TE0, TM0, etc.) at the input and output ports of the device, and the simulation results will provide the S matrix only for these selected port modes. The dimension of the User S Matrix depends on the number of ports and the number of modes selected at each port. For example, for a three-port device, if one mode is selected at each port, a 3×3 S matrix is obtained, which includes reflection coefficients (e.g., S11) and transmission coefficients (e.g., S21).
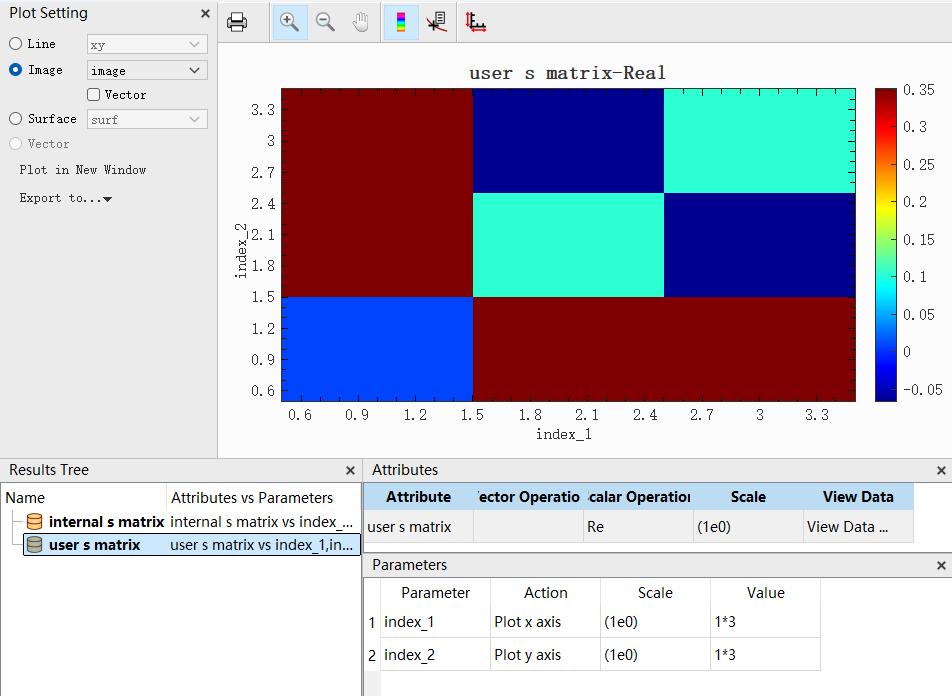
Furthermore, taking a two-port device as an example, if two modes are selected at each port for calculation, a 4×4 S matrix is obtained. The result is shown in the software as illustrated below:
The indexing of this 4×4 S matrix follows the rules shown in the figure below. Each element Smn of the matrix represents the transmission coefficient from the input port/mode combination n to the output port/mode combination m.

| Name | Description |
|---|---|
| S11 | Reflection coefficient for output Port1, Mode1 from input Port1, Mode1. |
| S12 | Reflection coefficient for output Port1, Mode1 from input Port1, Mode2. |
| S13 | Transmission coefficient for output Port1, Mode1 from input Port2, Mode1. |
| S14 | Transmission coefficient for output Port1, Mode1 from input Port2, Mode2. |
| S21 | Reflection coefficient for output Port1, Mode2 from input Port1, Mode1. |
| ... | ... |
| S33 | Reflection coefficient for output Port2, Mode1 from input Port2, Mode1. |
| ... | ... |
| S44 | Reflection coefficient for output Port2, Mode2 from input Port2, Mode2. |
Cell and Port Results #
In the EME simulation, each cell independently solves for eigenmodes; this mode information is the basis for constructing the S parameters. Users can view the result data for a single cell:
| Name | Description |
|---|---|
| neff | The effective index of each mode. |
| neff_TE | The TE polarization similarity of the mode. |
| neff_TM | The TM polarization similarity of the mode. |
| index | The refractive index distribution data of the current cell (function of spatial coordinates). |
| Mode Fields | The field profile of each mode on the cell cross-section, used to visualize the mode shape and energy distribution. |
| TE Fraction | The TE polarization fraction of each mode (0 to 1), indicating the proportion of TE component in the mode energy. |
| mode selection | The mode number selected by the user at this cell. |
| overlap | The overlap integral between modes of the current cell and adjacent cell, used to analyze mode coupling in different cells. |
| S | The S-parameter matrix describing the coupling between different modes of the current cell and the next cell. |
Ports are typically located at the boundaries of the EME simulation region, and mode information at these locations can also be obtained. Therefore, the data types for port results are essentially the same as those for cell results.