Whispering Gallery Modes of a Microdisk
Preface
The whispering gallery modes of a microdisk use the total internal reflection (TIR) of light to confine the light within the microdisk to achieve light enhancement. Simply put, when light propagates in a medium cavity with a high refractive index, the light will be completely reflected at the boundary of the medium due to the difference in refractive index between the medium cavity and the outside world. When the light travels around the boundary of the medium and returns to its original position, the light that meets the phase matching conditions will be enhanced. The whispering gallery mode of a microdisk has a high quality factor and a small mode volume, so it has important applications in many aspects such as optical detection, nonlinear optics, cavity optomechanics, and quantum optics. It is a frontier and popular field of current optical research. In this case, we hope to find the first- and second-order whispering gallery modes of GaN cylinders, reproducing the results in the paper Room-temperature continuous-wave lasing in GaN/InGaN microdisks[1] written by Tamboli et al.
Simulation settings
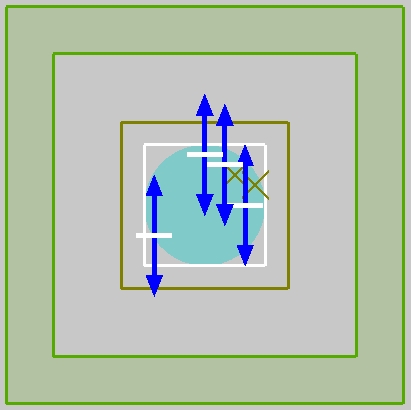
To avoid serious destructive interference, the dipole sources in this example cannot be placed at highly symmetrical positions and must be randomly distributed. Generally speaking, the Fourier transform can be used to find the resonant frequency of the structure for the electric field signals of the time monitor. However, since the gallium nitride disk in this example is a high-Q device, the electric field signal in the time domain will not be completely attenuated at the end of the simulation, so we use the spectral information obtained from the FDFP monitor to find the resonant frequency of the structure. To avoid transient signals at the start/end of simulation for high-Q devices, the FDFP monitor needs to use the Full apodization function.
Simulation results
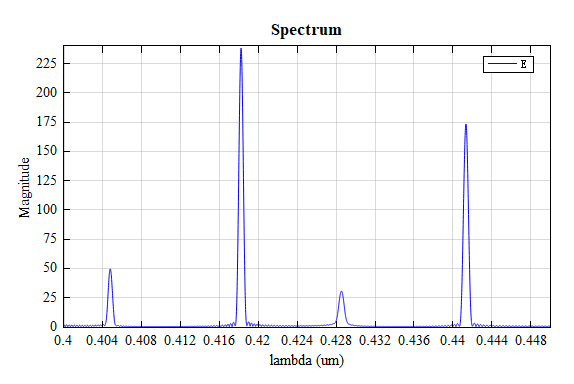
The figure below shows the spectrum obtained from the FDFP monitor. As can be seen from the figure, the resonance wavelengths are and respectively. To obtain more accurate results, you can use a finer mesh.
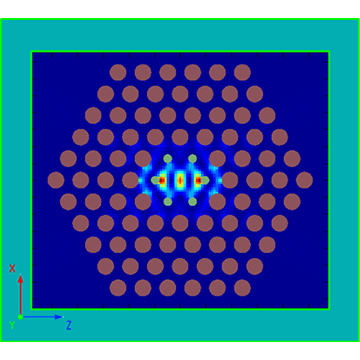
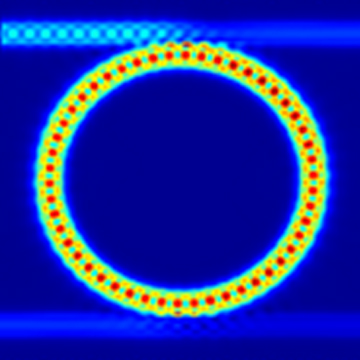
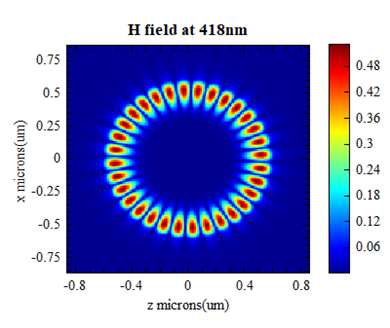
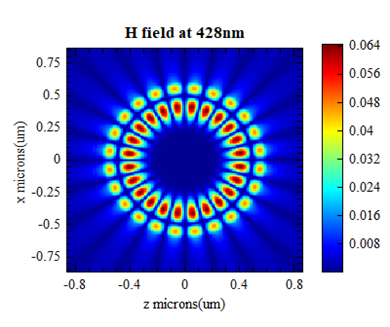
The figures below show the magnetic field distribution of the microdisk when the resonance wavelength is and respectively. As can be seen from the figure, when the resonance wavelength is , the resonant mode is the first-order mode of the microdisk, and when the resonance wavelength is , it is the second-order mode of the microdisk. The simulation results are consistent with those given in Figure4 in the reference.
References
A. C. Tamboli, E.D. Haberer, R. Sharma, K. H. Lee, S. Nakamura and E. L. Hu, Room-temperature continuous-wave lasing in GaN/InGaN microdisks, Nature Photonics, v1, pp. 61–64 (2007) ↩︎