共振型生物传感光栅
前言
在现代生物传感技术中,基于光学共振结构的传感器因其高灵敏度与无标记检测能力而受到广泛关注。共振型光栅结构作为一种典型的纳米尺度光学元件,能够在外界环境折射率发生微小变化时,通过其反射或透射光谱中的共振峰位移实现高精度检测,这一特性使其在生物分子识别、环境检测与医疗诊断等领域具有重要应用价值。本案例根据 等人的工作[1],对一个典型的共振型生物传感光栅进行了建模仿真,并分析了其光学响应特性。
仿真设置
模型简介
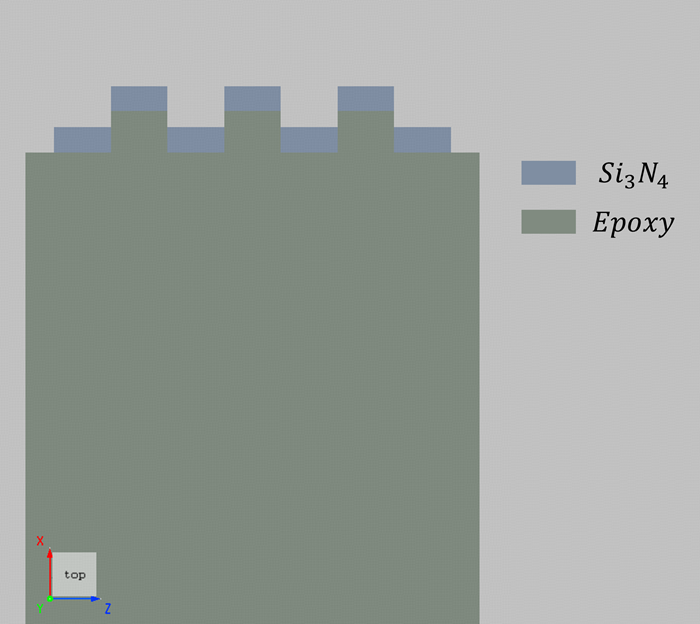
本案例所采用的器件结构如上图所示。基底材料为环氧树脂,其折射率为 。在基底表面构建周期性光栅结构,光栅周期为 ,高度为 ,并在光栅顶部沉积一层厚度为 的氮化硅薄膜。整个器件结构浸没在水中,在 FDTD 仿真中可通过将背景折射率设置为 来实现该条件。
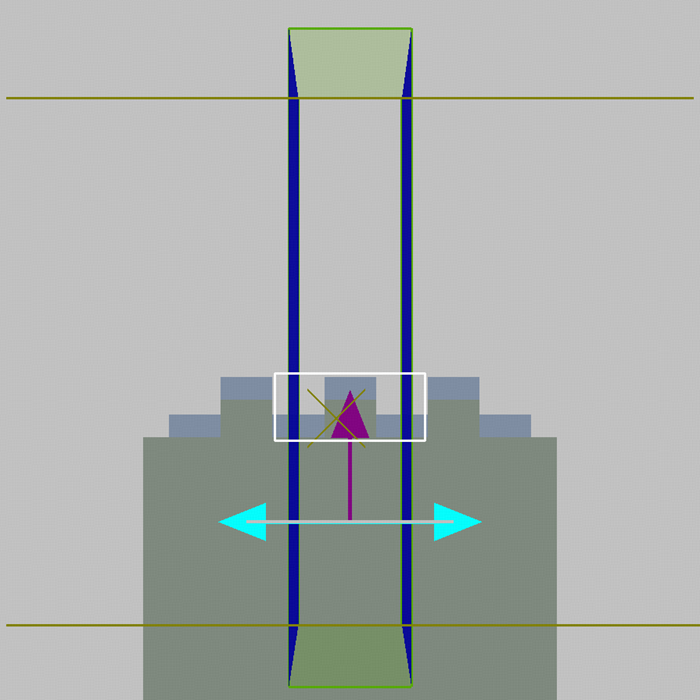
仿真采用波长范围为 的平面波光源,光源沿 轴正方向垂直入射至结构表面。在 Z 方向上使用周期边界条件,这样可以只通过一个周期的仿真得到在该方向上无限周期的电磁响应结果。该结构表现出显著的共特性振,其共振模式衰减时间较长,但是共振的能量仅占总能量的极小部分。因此,在仿真设置中需要将自动截至条件设置为 ,以确保共振过程得到充分收敛。
仿真结果
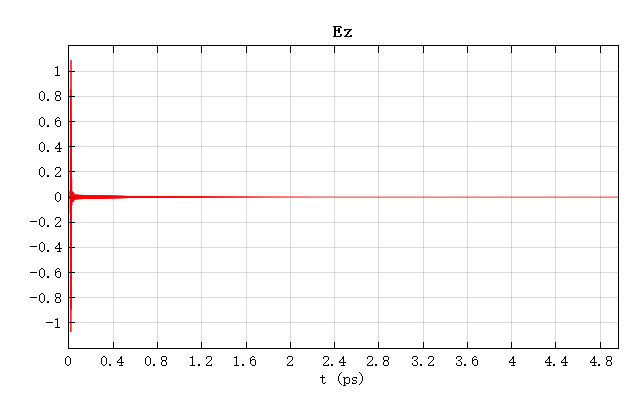
运行仿真后,光栅结构中电场分量 随时间的演化如下图所示。可以看到,电场幅值在激励结束后已充分衰减至接近零,表明系统中的共振模式已经完全衰减。这说明仿真时间设置是充足的,监视器所记录的频域结果具有良好的收敛性与可靠性。
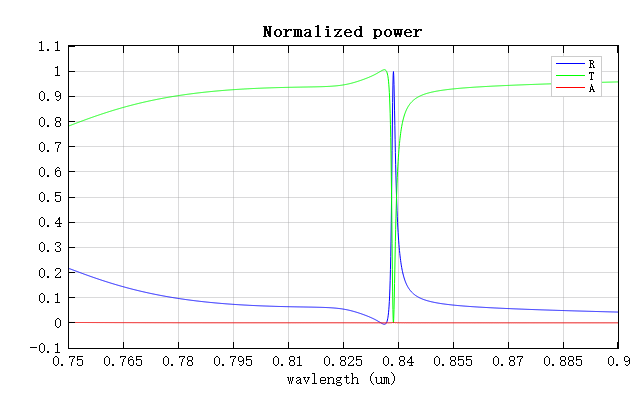
在此基础上,运行附件中的 grating_silicon_nitride.msf 脚本,绘制出器件的反射率( )、透射率( )以及吸收率( )随波长变化的光谱,结果如下图所示。在波长约为 处出现一个明显而尖锐的共振峰,此时反射率接近 ,入射光几乎完全被反射,而透射率与吸收率均降至极低水平,表明该结构在该波长处激发了强烈的共振模式。
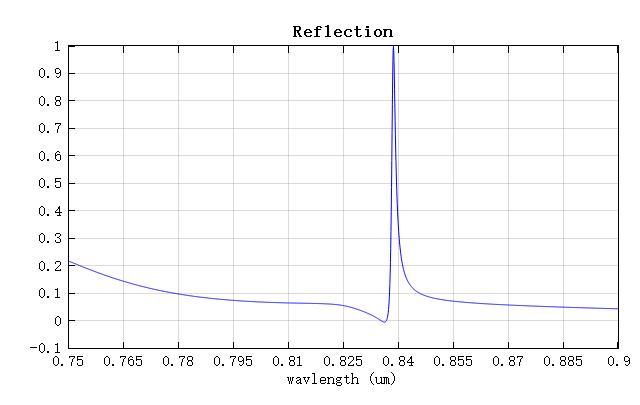
仅绘制反射光谱,如下图所示。可以看到,仿真结果与 Cunningham 等人[1:1]文献中 figure 3 所展示的实验结果几乎相同。这些小差异可能源于实际材料折射率与模拟中使用数值的差异,以及器件制造过程中的制造缺陷。
为评估谐振生物传感光栅的折射率传感性能,在实际传感器性能表征中,通常需要对多种生物溶液或不同折射率条件进行扫描,并通过多点拟合获得传感器的平均灵敏度。本案例在仿真中将 FDTD 的背景折射率由水替换为生理盐水( ),仅用于展示该评估方法。
传感器的频率灵敏度定义为:
其中 RIU(Refractive Index Unit,折射率单位)为量化光学传感器灵敏度时折射率变化的常规单位。
运行 grating_silicon_nitride.msf 脚本后,该谐振生物传感光栅的灵敏度将自动输出至脚本行命令窗口中,结果如下所示:
The frequency sensitivity of the sensor is 42616.9 GHz/RIU
结果表明,当周围介质折射率升高时,共振峰发生红移,对应的频率灵敏度为 ,说明该共振模式对环境折射率变化具有高度敏感性。